Market Outlook
August 31, 2016
Market Cues
Domestic Indices
Chg (%)
(Pts)
(Close)
Indian markets are likely to open flat with negative bias tracking SGX Nifty.
BSE Sensex
1.6
440
28,343
Nifty
1.6
137
8,744
US stocks slipped on Tuesday after stronger than expected US consumer confidence
Mid Cap
0.8
104
13,168
data stoked concerns about potential Fed rate hike this year and technology stocks
Small Cap
1.0
127
12,626
dragged. Apple was down just under 1% after EU antitrust regulators ordered the
iPhone maker to pay about $14.5bn in back taxes to Irish government.
Bankex
1.5
328
22,387
London's leading shares dipped in Tuesday afternoon trading to close in negative
Global Indices
Chg (%)
(Pts)
(Close)
territory, with mining stocks leading the downward trend. Mining firms weighed on
the market as the price of copper dropped to 10-week low. Antofagasta shares fell
Dow Jones
(0.3)
(49)
18,454
5.5%, while Rio Tinto slid 4.7%. Primark owner Associated British Foods was biggest
Nasdaq
(0.2)
(10)
5,223
gainer on the index, gaining 3.4%.
FTSE
(0.3)
(17)
6,821
Nifty ended at 16-month closing high on Tuesday, tracking positive global cues and
Nikkei
(0.1)
(12)
16,725
due to improved FII inflow despite likely Fed rate hike. Market sentiment was also
Hang Seng
0.9
195
23,016
boosted after RBI's optimistic statement, saying that the economy is likely to grow at
Shanghai Com
0.2
5
3,075
7.6% in FY17, though it quashed hopes of further repo rate cut in its annual report.
Market gained for 3rd consecutive session. Sensex was up 440pts to end at fresh
Advances / Declines
BSE
NSE
13-month closing high.
Advances
1,636
1,009
News Analysis
Declines
1,099
578
Green panel clears SAIL's `5,419cr modernization plans
Unchanged
210
95
Indian Oil raises oil import from Iran to 5MT for FY2017
Detailed analysis on Pg2
Volumes (` Cr)
Investor’s Ready Reckoner
BSE
3,458
Key Domestic & Global Indicators
NSE
19,707
Stock Watch: Latest investment recommendations on 150+ stocks
Refer Pg5 onwards
Net Inflows (` Cr)
Net
Mtd
Ytd
FII
558
8,474
39,356
Top Picks
CMP
Target
Upside
MFs
274
1,320
10,109
Company
Sector
Rating
(`)
(`)
(%)
Amara Raja
Auto/Auto Ancillary
Buy
925
1,076
16.3
Top Gainers
Price (`)
Chg (%)
HCL Tech
IT
Buy
774
1,000
29.2
Gmdcltd
98
8.3
HDFC Bank
Financials
Accumulate
1,268
1,350
6.5
Orientbank
124
7.8
Bharat Electronics
Capital Goods
Buy
1,219
1,414
16.0
Jubilant
544
7.0
Equitas Holdings
Financials
Buy
178
235
31.8
Navkar Corporation Others
Buy
198
265
33.9
Albk
84
6.7
More Top Picks on Pg4
Geship
361
5.9
Key Upcoming Events
Previous
Consensus
Top Losers
Price (`)
Chg (%)
Date
Region
Event Description
Reading
Expectations
Den
81
(3.9)
Aug 31 US
Initial Jobless claims
261.0
265.0
Bhartiartl
332
(2.8)
Sep 01 Germany
PMI Manufacturing
53.6
Pghh
6,599
(1.9)
Sep 01 UK
PMI Manufacturing
48.2
Vrllog
288
(1.6)
Sep 02 China
PMI Manufacturing
49.9
49.8
Jisljaleqs
83
(1.5)
Sep 02 US
Unemployment rate
4.9
4.8
6.(
As on August 30, 2016
More Events on Pg5
Market Outlook
August 31, 2016
News Analysis
Green panel clears SAIL's `5,419cr modernization plans
Central Green panel has given Environment Clearance (EC) to Steel Authority of
India Ltd's (SAIL) `5,419cr expansion and modernisation project for its Rourkela
plant at Odisha. SAIL has proposed modernisation of its Rourkela Steel Plant (RSP)
by setting up new hot strip mill with 3MTPA (million tonnes per annum) production
capacity, beneficiation plant of 3.3MTPA and pellet plant of 2MTPA. It also seeks
to enhance production capacity of special plates from 0.003 to 0.015 MTPA within
the premise of RSP. SAIL's proposal was examined in recent Expert Appraisal
Committee (EAC) meeting, which comes under Environment Ministry.
The ore for new plants would be procured from captive mines at Kiriburu,
Meghahatuburu, Bolani, Barsua and Gua in Odisha. Among specific conditions,
EAC has suggested that SAIL should install 24x7 air monitoring devices to control
air emissions and vehicular pollution due to transportation of raw material and
finished product.
SAIL has been asked to ensure green belt cover of over 33% of total project area
developed within plant premises. It has also been asked to make provision for
temporary housing structures for construction labour within the site with necessary
infrastructure and facilities.
At present, RSP has 4.5MTPA production capacity of hot metal and 4.2MTPA of
crude steel. It is SAIL's only plant that produce silicon steel for the power sector and
high quality pipes for the Oil and Gas sector. SAIL produces Iron and Steel at 5
integrated plants and 3 Special Steel plants, located in eastern & central regions.
Indian Oil raises oil import from Iran to 5MT for FY2017
Indian Oil Corp (IOCL), the nation's biggest oil firm, has raised crude Oil Import
from Iran to 4-fold (from 1.2MT in FY2016 to 5MT in FY2017) and has cleared
most of past payments as sanctions against Iran were eased.
India has steadily raised crude oil imports from Iran after US sanctions were lifted
in Jan-2016. Iran today is India's 4th biggest crude oil supplier. With lifting of
sanctions in Jan-2016, crude oil imports have steadily climbed. India imported
12.7MT of crude oil in FY2016, up from 11MT in the previous two fiscals.
IOC Director (Refineries) Sanjiv Singh said IOCL had paid $510mn out of the total
outstanding of $621mn due to Iran in past oil dues. Sanctions blocked payment
routes and dues had accumulated over the past couple of years. After accounting
for exchange variations, total outstanding due is only $55mn now.
This is a positive development for IOCL, as their input costs for refining could
slightly come down, once imports from Iran start gaining traction. We maintain
our Neutral rating on the stock.
Market Outlook
August 31, 2016
Economic and Political News
Maharashtra scraps 94 tenders of 14 irrigation projects under ACB probe
Govt raises minimum wage at `350 a day as union strike nears
Vehicle scrapping policy to provide `14k-cr benefit: Nitin Gadkari
Telangana govt's 'Mission Kakatiya' to get funding boost
Corporate News
Tata Motors lines up new vehicles; to phase out legacy products
IDBI Bank raises `1,500cr via tier I bonds
DLF close to 40% stake sale in rental assets arm
Rcom evaluating options regarding 700 MHz spectrum
Phoenix Mills looks to sell stakes in two malls
Quarterly Bloomberg Brokers Consensus Estimate
Bharat Petroleum Corp Ltd - Sep 1, 2016
Particulars (` cr)
1QFY17E
1QFY16
y-o-y (%)
4QFY16 q-o-q (%)
Net sales
49,977
51,917
(3.7)
44,146
13.2
EBITDA
3,485
3,818
(8.7)
3,490
(0.1)
EBITDA margin (%)
7.0
7.4
7.9
Net profit
2,172
2,376
(8.6)
2,549
(14.8)
Market Outlook
August 31, 2016
Top Picks ★★★★★
Large Cap
Market Cap
CMP
Target
Upside
Company
Rationale
(` Cr)
(`)
(`)
(%)
To outpace battery industry growth due to better technological
Amara Raja Batteries
15,807
925
1,076
16.3
products leading to market share gains in both the automotive
OEM and replacement segments.
Uptick in defense capex by government, coupled with BELs
Bharat Electronics
29,255
1,219
1,414
16.0
strong market positioning, indicate good times ahead for BEL.
HCL Tech
1,09,150
774
1,000
29.2
Stock is trading at attractive valuations & factors all bad news.
Strong visibility for a robust 20% earnings trajectory, coupled
HDFC Bank
3,20,898
1,268
1,350
6.5
with high quality of earnings on account of high quality retail
business and strategic focus on highly rated corporates.
Back on the growth trend, expect a long term growth of 14% to
Infosys
2,39,112
1,041
1,370
31.6
be a US$20bn in FY2020.
Source: Company, Angel Research
Mid Cap
Market Cap
CMP
Target
Upside
Company
Rationale
(` Cr)
(`)
(`)
(%)
Favourable outlook for the AC industry to augur well for
Cooling products business which is out pacing the market
Blue Star
4,743
497
527
6.0
growth. EMPPAC division's profitability to improve once
operating environment turns around.
Strong loan growth backed by diversified loan portfolio and
Equitas Holdings
5,981
178
235
31.8
adequate CAR. ROE & ROA likely to remain decent as risk of
dilution remains low. Attractive valuations considering growth.
Expectations of above average monsoon augurs well for
Goodyear India
1,282
556
631
13.5
Goodyear India as it derives ~50% of its turnover from farm
tyre segment.
Commencement of new projects, downtrend in the interest rate
IL&FS Transport
2,372
72
93
29.0
cycle, to lead to stock re-rating
Economic recovery to have favourable impact on advertising &
Jagran Prakashan
6,139
188
205
9.2
circulation revenue growth. Further, the acquisition of a radio business
(Radio City) would also boost the company`s revenue growth.
Speedier execution and speedier sales, strong revenue visibility
Mahindra Lifespace
1,769
431
522
21.1
in short-to-long run, attractive valuations
Massive capacity expansion along with rail advantage at ICD as
Navkar Corporation
2,823
198
265
33.9
well CFS augurs well for the company
Earnings boost on back of stable material prices and favourable
Radico Khaitan
1,371
103
125
21.3
pricing environment. Valuation discount to peers provides
additional comfort
Market leadership in Hindi news genre and no. 2 viewership
TV Today Network
1,827
306
363
18.5
ranking in English news genre, exit from the radio business, and
anticipated growth in ad spends by corporates to benefit the stock.
Source: Company, Angel Research
Market Outlook
August 31, 2016
Key Upcoming Events
Result Calendar
Date
Company
Sep 1, 2016
BPCL
Sep 5, 2016
Petronet LNG
Sep 7, 2016
BHEL, ONGC
Sep 8, 2016
SAIL
Sep 9, 2016
GSPL
Source: Bloomberg, Angel Research
Global economic events release calendar
Date
Time
Country
Event Description
Unit
Period
Bloomberg Data
Last Reported Estimated
Aug 31, 2016 6:00PM US
Initial Jobless claims
Thousands
Aug 27
261.00
265.00
Sep 1, 2016
1:25PM Germany
Unemployment change (000's)
Thousands
Aug
(7.00)
(4.00)
1:25PM Germany
PMI Manufacturing
Value
Aug F
53.60
53.60
6:00PM US
Change in Nonfarm payrolls
Thousands
Aug
255.00
180.00
2:00PM UK
PMI Manufacturing
Value
Aug
48.20
49.00
Sep 2, 2016
6:30AM China
PMI Manufacturing
Value
Aug
49.90
49.80
6:00PM US
Unnemployment rate
%
Aug
4.90
4.80
Sep 5, 2016
1:25PM Germany
PMI Services
Value
Aug F
53.30
--
Sep 6, 2016
2:30PM Euro Zone
Euro-Zone GDP s.a. (QoQ)
% Change
2Q F
0.30
--
Sep 7, 2016
2:00PM UK
Industrial Production (YoY)
% Change
Jul
1.60
--
Sep 8, 2016
China
Exports YoY%
% Change
Aug
(4.40)
--
5:15PM Euro Zone
ECB announces interest rates
%
Sep 8
--
--
Sep 9, 2016
India
Imports YoY%
% Change
Aug
(19.03)
--
India
Exports YoY%
% Change
Aug
(6.84)
--
7:00AM China
Consumer Price Index (YoY)
% Change
Aug
1.80
--
Sep 12, 2016 2:00PM UK
CPI (YoY)
% Change
Aug
0.60
--
Sep 13, 2016 5:30PM India
Industrial Production YoY
% Change
Jul
2.10
--
7:30AM China
Industrial Production (YoY)
% Change
Aug
6.00
--
Sep 14, 2016 2:00PM UK
Jobless claims change
% Change
Aug
(8.60)
--
12:00PM India
Monthly Wholesale Prices YoY%
% Change
Aug
3.55
--
Sep 15, 2016 2:30PM Euro Zone
Euro-Zone CPI (YoY)
%
Aug F
0.20
--
6:45PM US
Industrial Production
%
Aug
0.74
--
US
Producer Price Index (mom)
% Change
Aug
(0.50)
--
4:30PM UK
BOE Announces rates
% Ratio
Sep 15
0.25
--
US
Producer Price Index (mom)
% Change
Aug
(0.50)
--
Source: Bloomberg, Angel Research
Market Outlook
August 31, 2016
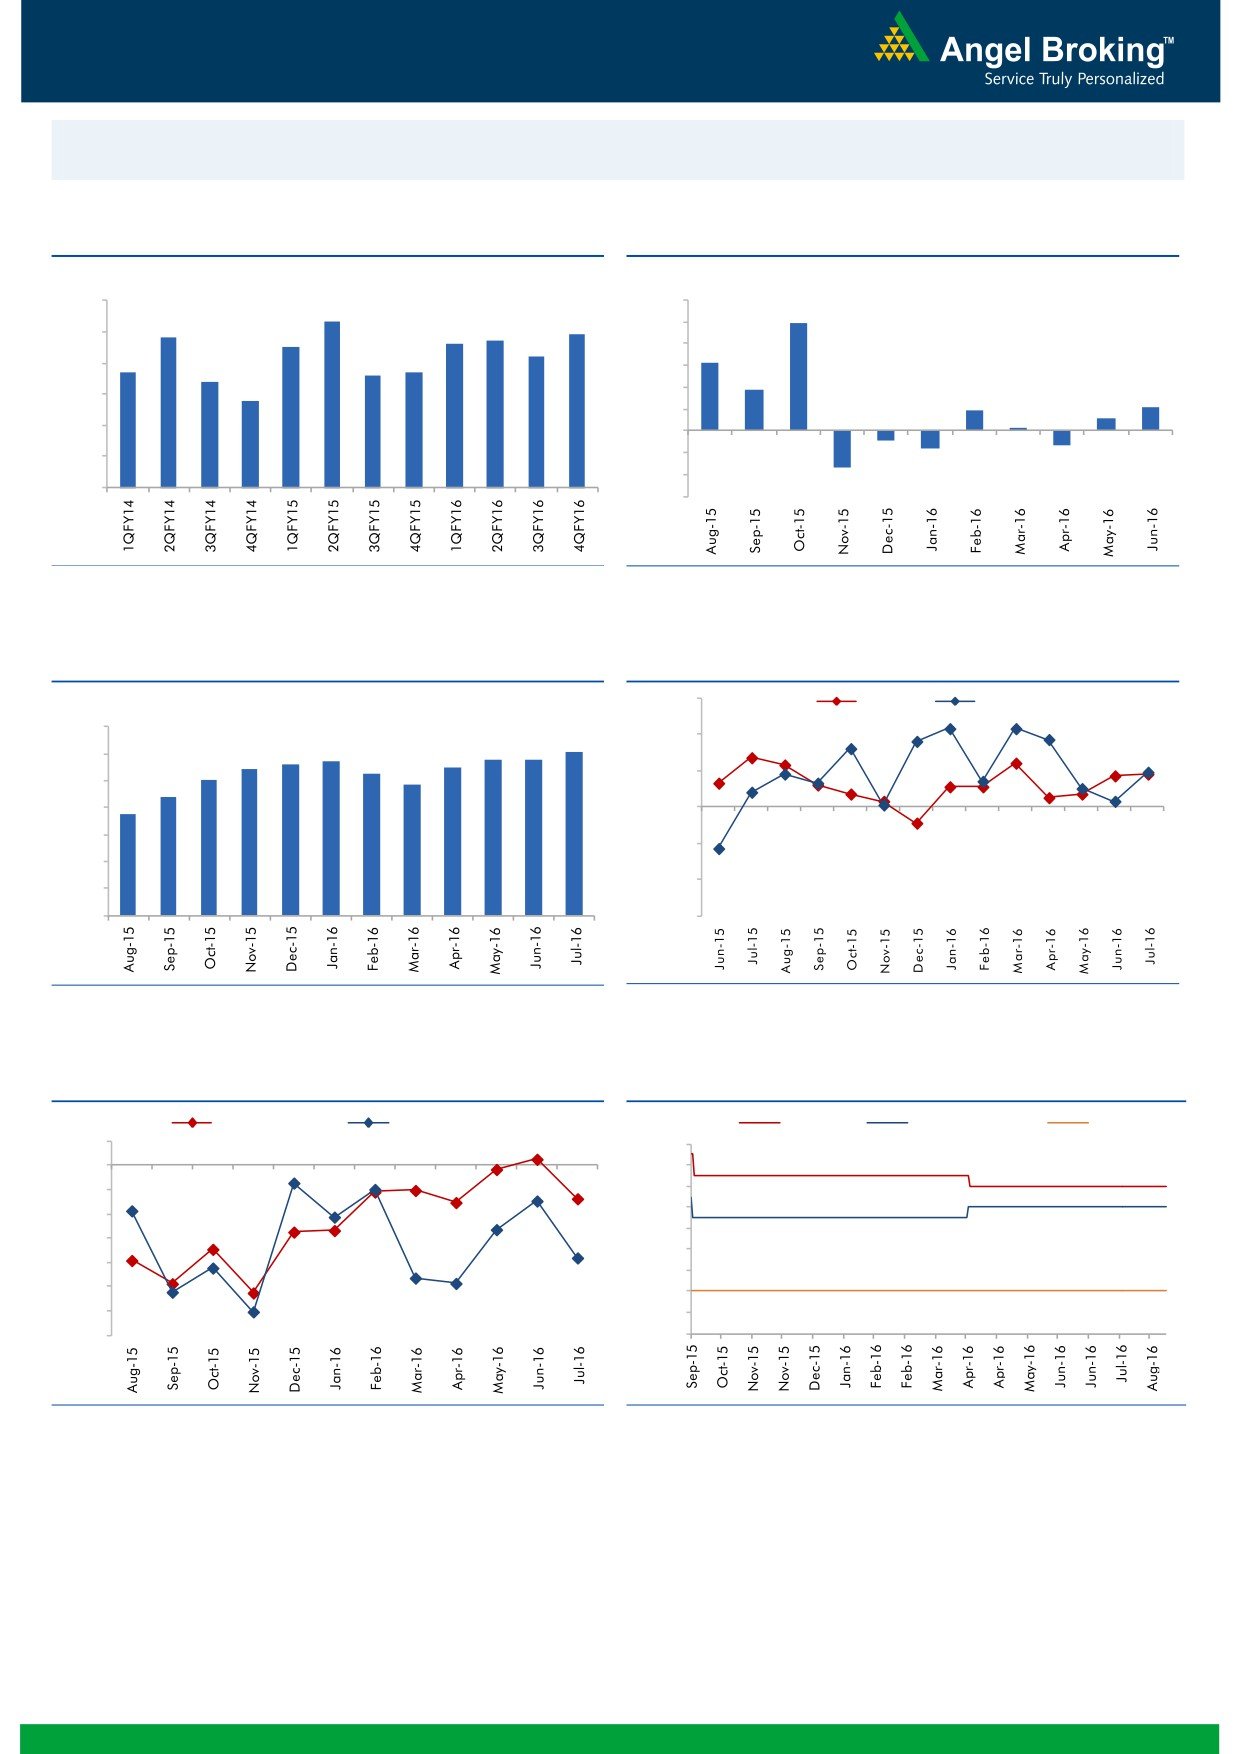
Macro watch
Exhibit 1: Quarterly GDP trends
Exhibit 2: IIP trends
(%)
(%)
9.0
8.3
12.0
9.9
7.8
7.7
7.9
10.0
8.0
7.5
7.6
7.2
8.0
6.3
6.7
6.6
6.7
7.0
6.4
6.0
3.7
5.8
4.0
2.1
6.0
1.9
1.1
2.0
0.3
5.0
-
4.0
(2.0)
(0.9)
(1.3)
(1.6)
(4.0)
3.0
(3.4)
(6.0)
Source: CSO, Angel Research
Source: MOSPI, Angel Research
Exhibit 3: Monthly CPI inflation trends
Exhibit 4: Manufacturing and services PMI
56.0
Mfg. PMI
Services PMI
(%)
7.0
6.1
54.0
5.6
5.7
5.8
5.8
5.4
5.5
6.0
5.3
5.0
4.8
52.0
5.0
4.4
3.7
4.0
50.0
3.0
48.0
2.0
46.0
1.0
-
44.0
Source: MOSPI, Angel Research
Source: Market, Angel Research; Note: Level above 50 indicates expansion
Exhibit 5: Exports and imports growth trends
Exhibit 6: Key policy rates
(%)
Exports yoy growth
Imports yoy growth
(%)
Repo rate
Reverse Repo rate
CRR
5.0
7.50
0.0
7.00
(5.0)
6.50
6.00
(10.0)
5.50
(15.0)
5.00
(20.0)
4.50
(25.0)
4.00
(30.0)
3.50
(35.0)
3.00
Source: Bloomberg, Angel Research
Source: RBI, Angel Research
Market Outlook
August 31, 2016
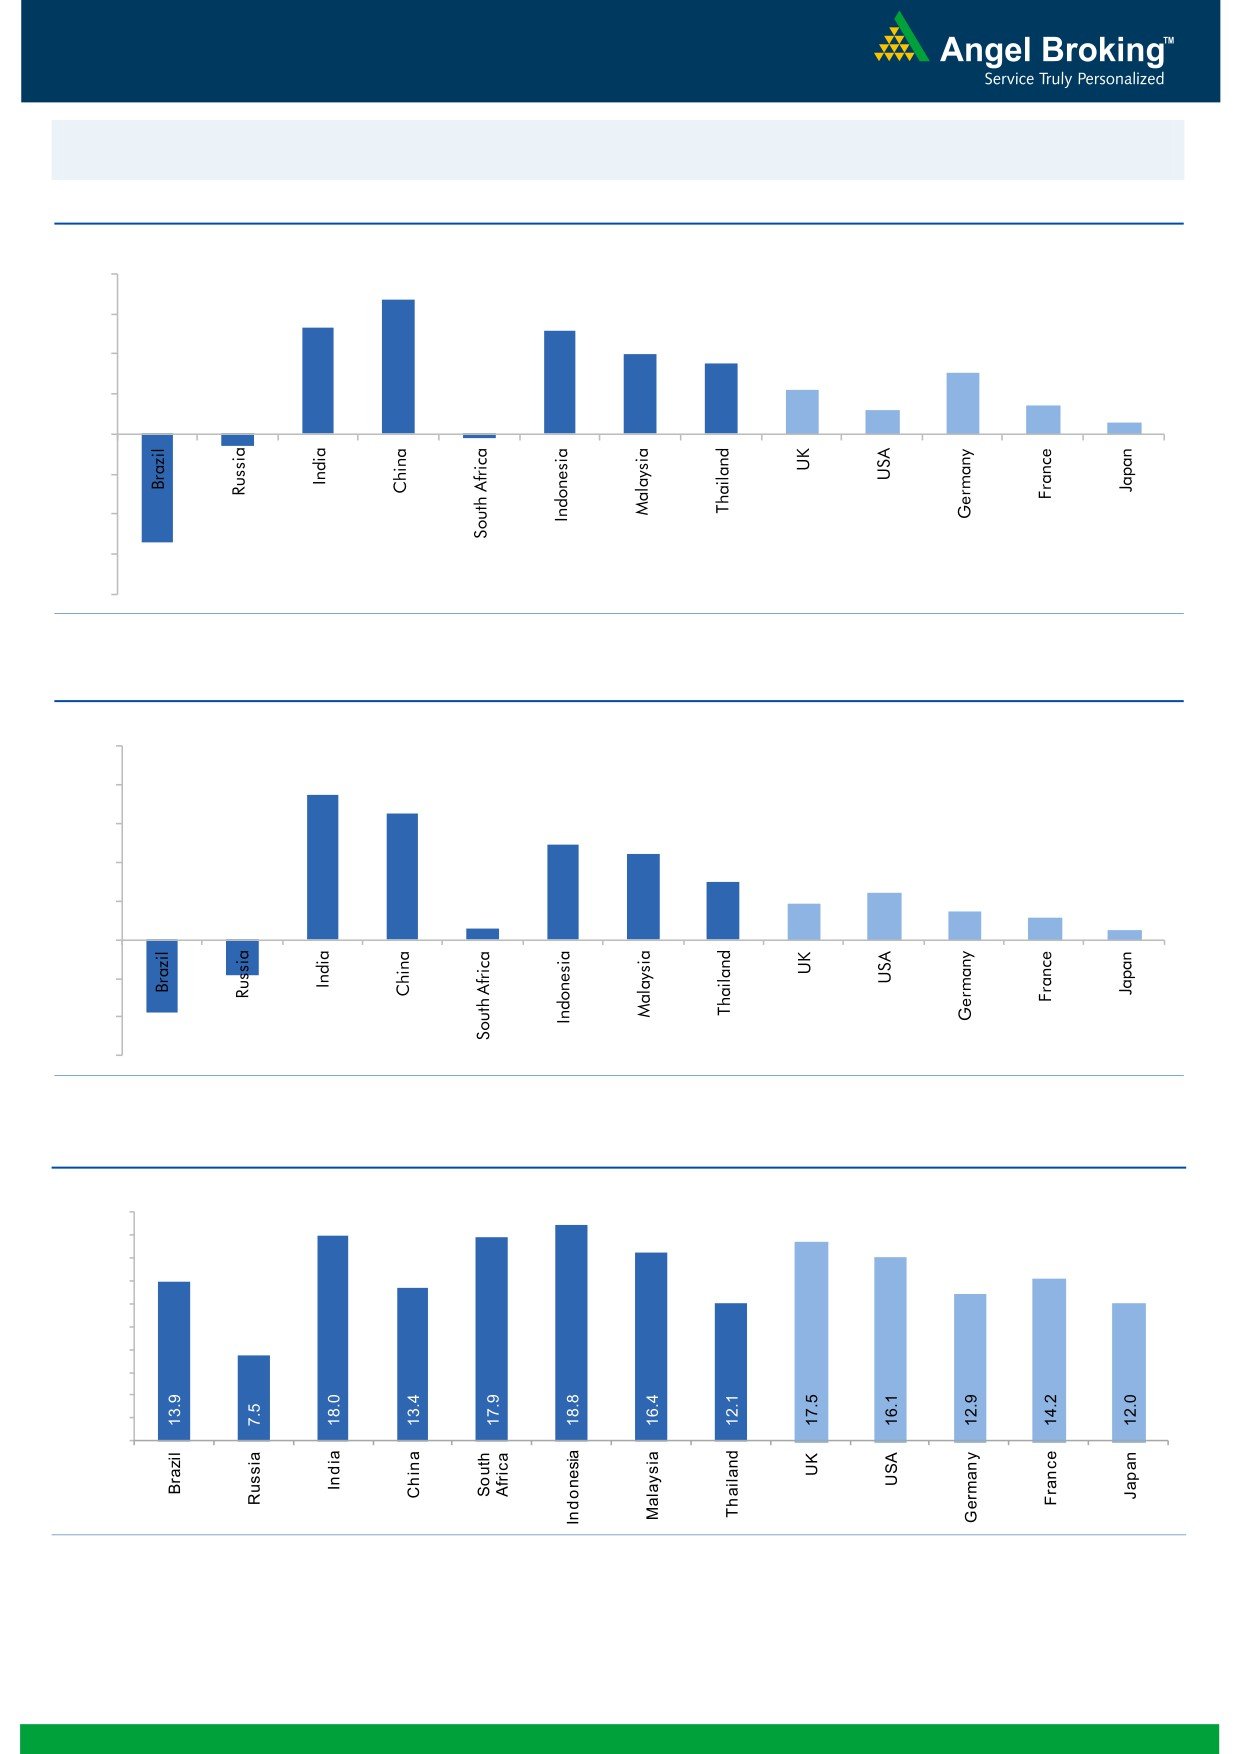
Global watch
Exhibit 1: Latest quarterly GDP Growth (%, yoy) across select developing and developed countries
(%)
8.0
6.7
6.0
5.3
5.2
4.0
3.5
4.0
3.1
2.2
2.0
1.2
1.4
0.6
-
(2.0)
(0.6)
(4.0)
(6.0)
(5.4)
(0.2)
(8.0)
Source: Bloomberg, Angel Research
Exhibit 2: 2016 GDP Growth projection by IMF (%, yoy) across select developing and developed countries
(%)
10.0
7.5
8.0
6.5
6.0
4.9
4.4
4.0
3.0
2.4
1.9
1.5
2.0
1.1
0.6
0.5
(3.8)
(1.8)
-
(2.0)
(4.0)
(6.0)
Source: IMF, Angel Research
Exhibit 3: One year forward P-E ratio across select developing and developed countries
(x)
20.0
18.0
16.0
14.0
12.0
10.0
8.0
6.0
4.0
2.0
-
Source: IMF, Angel Research
Market Outlook
August 31, 2016
Exhibit 4: Relative performance of indices across globe
Returns (%)
Country
Name of index
Closing price
1M
3M
1YR
Brazil
Bovespa
58,575
2.2
19.5
31.5
Russia
Micex
1,986
2.1
4.6
15.5
India
Nifty
8,744
0.9
6.9
5.4
China
Shanghai Composite
3,075
3.9
5.2
(12.5)
South Africa
Top 40
46,819
(0.1)
(2.6)
7.3
Mexico
Mexbol
47,651
2.1
4.6
11.0
Indonesia
LQ45
923
3.5
12.8
23.6
Malaysia
KLCI
1,678
1.5
2.5
6.6
Thailand
SET 50
983
1.6
10.0
9.6
USA
Dow Jones
18,454
0.1
3.8
14.9
UK
FTSE
6,821
1.5
9.5
12.1
Japan
Nikkei
16,725
1.5
(2.0)
(17.3)
Germany
DAX
10,658
3.1
4.4
3.3
France
CAC
4,457
0.4
(0.4)
(3.1)
Source: Bloomberg, Angel Research
Stock Watch
August 31, 2016
Company Name
Reco
CMP
Target
Mkt Cap
Sales ( Čcr )
OPM(%)
EPS (Č)
PER(x)
P/BV(x)
RoE(%)
EV/Sales(x)
(Č)
Price ( Č)
( Č cr )
FY17E FY18E
FY17E
FY18E
FY17E
FY18E
FY17E
FY18E
FY17E
FY18E
FY17E
FY18E
FY17E
FY18E
Agri / Agri Chemical
Rallis
Neutral
226
-
4,393
1,937
2,164
13.3
14.3
9.0
11.0
25.1
20.5
4.4
3.8
18.4
19.8
2.3
2.0
United Phosphorus
Accumulate
639
684
27,386
15,176
17,604
18.5
18.5
37.4
44.6
17.1
14.3
3.4
2.8
21.4
21.2
1.9
1.6
Auto & Auto Ancillary
Ashok Leyland
Buy
88
111
25,158
22,407
26,022
10.6
10.6
5.2
6.4
16.9
13.8
3.8
3.2
23.6
24.7
1.2
1.0
Bajaj Auto
Neutral
2,982
-
86,294
25,093
27,891
19.5
19.2
143.9
162.5
20.7
18.4
5.8
5.0
30.3
29.4
3.2
2.8
Bharat Forge
Neutral
861
-
20,032
7,726
8,713
20.5
21.2
35.3
42.7
24.4
20.2
4.5
4.1
18.9
20.1
2.7
2.3
Eicher Motors
Neutral
23,043
-
62,588
16,583
20,447
17.5
18.0
598.0
745.2
38.5
30.9
13.2
10.0
41.2
38.3
3.6
2.9
Gabriel India
Neutral
118
-
1,688
1,544
1,715
9.0
9.3
5.4
6.3
21.8
18.7
4.1
3.6
18.9
19.5
1.0
0.9
Hero Motocorp
Neutral
3,473
-
69,358
31,253
35,198
15.3
15.0
172.3
192.1
20.2
18.1
7.4
6.3
38.9
37.0
2.1
1.8
Jamna Auto Industries Neutral
225
-
1,800
1,486
1,620
9.8
9.9
15.0
17.2
15.0
13.1
3.3
2.8
21.8
21.3
1.3
1.2
L G Balakrishnan & Bros Neutral
469
-
736
1,302
1,432
11.6
11.9
43.7
53.0
10.7
8.9
1.5
1.4
13.8
14.2
0.7
0.6
Mahindra and Mahindra Neutral
1,437
-
89,223
46,534
53,077
11.6
11.7
67.3
78.1
21.3
18.4
3.5
3.0
15.4
15.8
1.9
1.6
Maruti
Neutral
5,069
-
153,121
69,186
82,217
14.7
14.4
198.5
241.4
25.5
21.0
5.0
4.0
20.2
20.0
1.9
1.5
Minda Industries
Neutral
1,258
-
1,996
2,728
3,042
9.0
9.1
68.2
86.2
18.5
14.6
4.2
3.3
23.8
24.3
0.8
0.7
Motherson Sumi
Neutral
325
-
43,042
45,896
53,687
7.8
8.3
13.0
16.1
25.0
20.2
8.0
6.4
34.7
35.4
1.0
0.8
Rane Brake Lining
Neutral
729
-
577
511
562
11.3
11.5
28.1
30.9
25.9
23.6
4.0
3.6
15.3
15.0
1.3
1.2
Setco Automotive
Neutral
45
-
603
741
837
13.0
13.0
15.2
17.0
3.0
2.7
0.5
0.4
15.8
16.3
1.2
1.1
Tata Motors
Neutral
528
-
152,531
300,209
338,549
8.9
8.4
42.7
54.3
12.4
9.7
2.0
1.7
15.6
17.2
0.6
0.5
TVS Motor
Neutral
326
-
15,481
13,390
15,948
6.9
7.1
12.8
16.5
25.5
19.7
6.4
5.0
26.3
27.2
1.2
1.0
Amara Raja Batteries
Buy
925
1,076
15,807
5,717
6,733
18.7
18.9
38.4
48.9
24.1
18.9
6.0
4.9
25.3
24.8
2.6
2.2
Exide Industries
Neutral
184
-
15,598
7,439
8,307
15.0
15.0
8.1
9.3
22.7
19.7
3.2
2.8
14.3
16.7
1.7
1.5
Apollo Tyres
Neutral
185
-
9,414
12,877
14,504
14.3
13.9
21.4
23.0
8.6
8.0
1.3
1.2
16.4
15.2
0.9
0.8
Ceat
Buy
906
1,119
3,665
7,524
8,624
13.0
12.7
131.1
144.3
6.9
6.3
1.3
1.1
19.8
18.6
0.6
0.5
JK Tyres
Neutral
133
-
3,015
7,455
8,056
15.0
15.0
21.8
24.5
6.1
5.4
1.3
1.0
22.8
21.3
0.5
0.4
Swaraj Engines
Neutral
1,158
-
1,438
660
810
15.2
16.4
54.5
72.8
21.3
15.9
6.6
6.0
31.5
39.2
2.0
1.6
Subros
Neutral
102
-
612
1,488
1,681
11.7
11.9
6.4
7.2
16.0
14.2
1.7
1.5
10.8
11.4
0.6
0.5
Indag Rubber
Neutral
185
-
486
286
326
19.8
16.8
11.7
13.3
15.8
13.9
2.7
2.5
17.8
17.1
1.4
1.2
Capital Goods
ACE
Neutral
43
-
429
709
814
4.1
4.6
1.4
2.1
31.0
20.7
1.3
1.2
4.4
6.0
0.8
0.7
BEML
Accumulate
1,065
1,157
4,435
3,451
4,055
6.3
9.2
31.4
57.9
33.9
18.4
2.0
1.9
6.3
10.9
1.4
1.2
Bharat Electronics
Buy
1,219
1,414
29,255
8,137
9,169
16.8
17.2
58.7
62.5
20.8
19.5
3.2
2.9
44.6
46.3
2.6
2.3
Stock Watch
August 31, 2016
Company Name
Reco
CMP
Target
Mkt Cap
Sales ( Čcr )
OPM(%)
EPS (Č)
PER(x)
P/BV(x)
RoE(%)
EV/Sales(x)
(Č)
Price ( Č)
( Č cr )
FY17E
FY18E
FY17E
FY18E
FY17E
FY18E
FY17E
FY18E
FY17E
FY18E
FY17E
FY18E
FY17E
FY18E
Capital Goods
Voltas
Neutral
394
-
13,020
6,511
7,514
7.9
8.7
12.9
16.3
30.5
24.1
5.5
4.8
16.7
18.5
1.8
1.5
BGR Energy
Neutral
115
-
829
16,567
33,848
6.0
5.6
7.8
5.9
14.7
19.5
0.8
0.8
4.7
4.2
0.2
0.1
BHEL
Neutral
141
-
34,425
28,797
34,742
-
2.8
2.3
6.9
61.2
20.4
1.0
1.0
1.3
4.8
0.9
0.6
Blue Star
Accumulate
497
527
4,743
4,351
5,024
6.4
7.1
17.2
20.6
29.0
24.1
18.8
15.7
23.1
24.1
1.1
1.0
Crompton Greaves
Neutral
82
-
5,136
5,777
6,120
5.9
7.0
3.3
4.5
24.8
18.2
1.1
1.0
4.4
5.9
0.8
0.7
Greaves Cotton
Neutral
138
-
3,374
1,755
1,881
16.8
16.9
7.8
8.5
17.7
16.3
3.5
3.3
20.6
20.9
1.6
1.5
Inox Wind
Buy
185
286
4,107
5,605
6,267
15.7
16.4
24.8
30.0
7.5
6.2
2.1
1.5
25.9
24.4
0.8
0.6
KEC International
Neutral
136
-
3,499
9,294
10,186
7.9
8.1
9.9
11.9
13.8
11.4
2.0
1.8
15.6
16.3
0.6
0.6
Thermax
Neutral
833
-
9,929
5,421
5,940
7.3
7.3
25.7
30.2
32.4
27.6
3.9
3.6
12.2
13.1
1.7
1.6
VATech Wabag
Buy
555
681
3,024
3,136
3,845
8.9
9.1
26.0
35.9
21.3
15.5
2.7
2.3
13.4
15.9
0.9
0.7
Cement
ACC
Neutral
1,689
-
31,726
11,225
13,172
13.2
16.9
44.5
75.5
38.0
22.4
3.6
3.3
11.2
14.2
2.8
2.4
Ambuja Cements
Neutral
274
-
54,466
9,350
10,979
18.2
22.5
5.8
9.5
47.3
28.9
4.0
3.6
10.2
12.5
5.8
5.0
India Cements
Neutral
151
-
4,645
4,364
4,997
18.5
19.2
7.9
11.3
19.1
13.4
1.4
1.3
8.0
8.5
1.8
1.6
JK Cement
Neutral
800
-
5,592
4,398
5,173
15.5
17.5
31.2
55.5
25.6
14.4
3.1
2.7
12.0
15.5
1.8
1.5
J K Lakshmi Cement
Neutral
453
-
5,336
2,913
3,412
14.5
19.5
7.5
22.5
60.5
20.2
3.7
3.1
12.5
18.0
2.4
2.0
Orient Cement
Neutral
188
-
3,845
2,114
2,558
18.5
20.5
8.1
11.3
23.2
16.6
3.4
2.9
9.0
14.0
2.4
1.9
UltraTech Cement
Neutral
3,889
-
106,719
25,768
30,385
21.0
23.5
111.0
160.0
35.0
24.3
4.5
3.9
13.5
15.8
4.2
3.5
Construction
ITNL
Buy
72
93
2,372
8,946
10,017
31.0
31.6
8.1
9.1
8.9
7.9
0.3
0.3
4.2
5.0
3.6
3.3
KNR Constructions
Accumulate
700
802
1,969
1,385
1,673
14.7
14.0
41.2
48.5
17.0
14.4
3.2
2.7
14.9
15.2
1.5
1.2
Larsen & Toubro
Buy
1,474
1,700
137,364
67,665
77,249
10.7
11.5
57.3
71.2
25.7
20.7
2.4
2.2
12.6
14.3
2.2
1.9
Gujarat Pipavav Port
Neutral
178
-
8,627
705
788
52.2
51.7
5.0
5.6
35.7
31.9
3.5
3.2
11.2
11.2
11.9
10.1
MBL Infrastructures
Buy
97
285
403
2,797
3,405
14.7
15.4
21.0
34.8
4.6
2.8
0.5
0.4
11.0
16.2
0.8
0.8
Nagarjuna Const.
Neutral
82
-
4,584
8,842
9,775
9.1
8.8
5.3
6.4
15.6
12.9
1.2
1.1
8.2
9.1
0.7
0.6
PNC Infratech
Accumulate
120
129
3,084
2,350
2,904
13.4
13.7
48.0
42.0
2.5
2.9
0.5
0.4
16.8
13.2
1.4
1.2
Simplex Infra
Neutral
294
-
1,454
6,829
7,954
10.5
10.5
31.4
37.4
9.4
7.9
1.0
0.9
9.9
13.4
0.6
0.5
Power Mech Projects
Neutral
456
-
671
1,801
2,219
12.7
14.6
72.1
113.9
6.3
4.0
1.2
1.0
16.8
11.9
0.4
0.3
Sadbhav Engineering
Neutral
295
-
5,065
3,598
4,140
10.3
10.6
9.0
11.9
32.8
24.8
3.4
3.0
9.9
11.9
1.7
1.4
NBCC
Neutral
240
-
14,379
7,428
9,549
7.9
8.6
8.2
11.0
29.2
21.8
1.5
1.2
28.2
28.7
1.7
1.2
MEP Infra
Neutral
44
-
712
1,877
1,943
30.6
29.8
3.0
4.2
14.6
10.4
7.1
4.8
0.6
0.6
1.8
1.6
Stock Watch
August 31, 2016
Company Name
Reco
CMP
Target
Mkt Cap
Sales ( Čcr )
OPM(%)
EPS (Č)
PER(x)
P/BV(x)
RoE(%)
EV/Sales(x)
(Č)
Price ( Č)
( Č cr )
FY17E
FY18E
FY17E
FY18E
FY17E
FY18E
FY17E
FY18E
FY17E
FY18E
FY17E
FY18E
FY17E
FY18E
Construction
SIPL
Neutral
97
-
3,420
1,036
1,252
65.5
66.2
(8.4)
(5.6)
3.6
4.2
(22.8)
(15.9)
11.5
9.6
Engineers India
Neutral
265
-
8,917
1,725
1,935
16.0
19.1
11.4
13.9
23.2
19.0
3.2
3.1
13.4
15.3
4.1
3.7
Financials
Axis Bank
Neutral
591
-
141,081
58,081
66,459
3.5
3.5
32.4
44.6
18.3
13.2
2.4
2.1
13.6
16.5
-
-
Bank of Baroda
Neutral
164
-
37,823
19,980
23,178
1.8
1.8
11.5
17.3
14.3
9.5
1.6
1.4
8.3
10.1
-
-
Canara Bank
Neutral
281
-
15,239
15,225
16,836
1.8
1.8
14.5
28.0
19.4
10.0
1.3
1.1
5.8
8.5
-
-
Dewan Housing Finance Neutral
290
-
8,456
2,225
2,688
2.9
2.9
29.7
34.6
9.8
8.4
1.6
1.4
16.1
16.8
-
-
Equitas Holdings
Buy
178
235
5,981
939
1,281
11.7
11.5
5.8
8.2
30.8
21.8
2.7
2.4
10.9
11.5
-
-
Federal Bank
Neutral
68
-
11,632
9,353
10,623
2.9
2.9
4.4
5.8
15.4
11.7
1.5
1.3
9.5
11.0
-
-
HDFC
Neutral
1,392
-
220,118
11,475
13,450
3.4
3.4
45.3
52.5
30.7
26.5
5.9
5.2
20.2
20.5
-
-
HDFC Bank
Accumulate
1,268
1,350
320,898
46,097
55,433
4.5
4.5
58.4
68.0
21.7
18.6
3.8
3.2
18.8
18.6
-
-
ICICI Bank
Neutral
256
-
149,000
39,029
45,903
3.3
3.3
16.7
16.3
15.3
15.7
1.9
1.7
10.1
12.4
-
-
LIC Housing Finance
Neutral
573
-
28,907
3,712
4,293
2.6
2.5
39.0
46.0
14.7
12.5
2.8
2.4
19.9
20.1
-
-
Punjab Natl.Bank
Neutral
127
-
24,948
23,532
23,595
2.3
2.4
6.8
12.6
18.7
10.1
2.9
2.1
3.3
6.5
-
-
South Ind.Bank
Neutral
23
-
3,052
6,435
7,578
2.5
2.5
2.7
3.1
8.4
7.3
1.1
0.9
10.1
11.2
-
-
St Bk of India
Neutral
252
-
195,777
88,650
98,335
2.6
2.6
13.5
18.8
18.7
13.4
1.8
1.6
7.0
8.5
-
-
Union Bank
Neutral
141
-
9,720
13,450
14,925
2.3
2.3
25.5
34.5
5.6
4.1
0.8
0.7
7.5
10.2
-
-
Yes Bank
Neutral
1,355
-
57,047
8,978
11,281
3.3
3.4
74.0
90.0
18.3
15.1
3.5
3.0
17.0
17.2
-
-
FMCG
Asian Paints
Neutral
1,147
-
110,001
17,128
18,978
16.8
16.4
19.1
20.7
60.0
55.4
20.9
19.7
34.8
35.5
6.3
5.7
Britannia
Neutral
3,442
-
41,294
9,795
11,040
14.6
14.9
80.3
94.0
42.9
36.6
17.6
13.6
41.2
-
4.1
3.6
Colgate
Neutral
951
-
25,864
4,605
5,149
23.4
23.4
23.8
26.9
40.0
35.4
22.1
17.3
64.8
66.8
5.5
4.9
Dabur India
Neutral
294
-
51,675
8,315
9,405
19.8
20.7
8.1
9.2
36.3
31.9
10.1
8.4
31.6
31.0
5.9
5.2
GlaxoSmith Con*
Neutral
6,285
-
26,434
4,350
4,823
21.2
21.4
179.2
196.5
35.1
32.0
9.3
7.9
27.1
26.8
5.5
4.8
Godrej Consumer
Neutral
1,564
-
53,254
10,235
11,428
18.4
18.6
41.1
44.2
38.1
35.4
8.4
7.1
24.9
24.8
5.3
4.7
HUL
Neutral
925
-
200,085
35,252
38,495
17.6
17.4
20.4
21.9
45.3
42.2
37.2
32.6
82.2
77.3
5.5
5.0
ITC
Accumulate
257
283
310,642
40,059
44,439
39.0
39.2
9.1
10.1
28.3
25.5
7.7
6.8
27.2
26.5
7.2
6.5
Marico
Neutral
287
-
37,034
6,430
7,349
18.8
19.5
6.4
7.7
44.9
37.3
13.5
11.4
33.2
32.5
5.6
4.8
Nestle*
Neutral
6,705
-
64,651
10,073
11,807
20.7
21.5
124.8
154.2
53.7
43.5
22.1
19.8
34.8
36.7
6.2
5.3
Tata Global
Neutral
140
-
8,848
8,675
9,088
9.8
9.8
7.4
8.2
19.0
17.1
2.2
2.1
7.9
8.1
0.9
0.9
Procter & Gamble
Accumulate
6,607
7,369
21,445
2,939
3,342
23.2
23.0
146.2
163.7
45.2
40.4
101.2
97.0
25.3
23.5
6.8
5.9
Hygiene
Stock Watch
August 31, 2016
Company Name
Reco
CMP
Target
Mkt Cap
Sales ( Čcr )
OPM(%)
EPS (Č)
PER(x)
P/BV(x)
RoE(%)
EV/Sales(x)
(Č)
Price ( Č)
( Č cr )
FY17E FY18E
FY17E
FY18E
FY17E
FY18E
FY17E
FY18E
FY17E
FY18E
FY17E
FY18E
FY17E
FY18E
IT
HCL Tech^
Buy
774
1,000
109,150
49,242
57,168
20.5
20.5
55.7
64.1
13.9
12.1
2.8
2.2
20.3
17.9
2.1
1.7
Infosys
Buy
1,041
1,370
239,112
69,934
79,025
27.5
27.5
64.8
72.0
16.1
14.5
3.5
3.2
22.0
22.3
2.9
2.5
TCS
Buy
2,549
3,004
502,203
121,684
136,286
27.3
27.3
135.0
150.1
18.9
17.0
6.3
5.8
33.2
33.9
3.9
3.4
Tech Mahindra
Buy
463
700
44,939
30,347
33,685
17.0
17.0
37.5
41.3
12.3
11.2
2.7
2.3
21.8
20.7
1.2
1.0
Wipro
Buy
489
680
120,843
51,631
55,822
21.7
17.9
35.9
36.9
13.6
13.3
2.8
2.6
19.0
18.1
2.0
1.8
Media
D B Corp
Neutral
410
-
7,530
2,297
2,590
27.4
28.2
21.0
23.4
19.5
17.5
4.6
3.9
23.7
23.1
3.1
2.7
HT Media
Neutral
88
-
2,055
2,693
2,991
12.6
12.9
7.9
9.0
11.2
9.8
1.0
0.9
7.8
8.3
0.3
0.2
Jagran Prakashan
Accumulate
188
205
6,139
2,355
2,635
28.0
28.0
9.9
10.8
19.0
17.4
3.8
3.3
21.7
21.7
2.6
2.3
Sun TV Network
Neutral
475
-
18,715
2,850
3,265
70.1
71.0
26.2
30.4
18.1
15.6
4.6
4.1
24.3
25.6
6.2
5.2
Hindustan Media
Neutral
286
-
2,098
1,016
1,138
24.3
25.2
27.3
30.1
10.5
9.5
2.0
1.8
16.2
15.8
1.4
1.2
Ventures
TV Today Network
Buy
306
363
1,827
637
743
27.5
27.5
18.4
21.4
16.7
14.3
2.9
2.5
17.4
17.2
2.5
2.0
Metals & Mining
Coal India
Neutral
335
-
211,535
84,638
94,297
21.4
22.3
24.5
27.1
13.7
12.4
5.7
5.4
42.6
46.0
2.0
1.8
Hind. Zinc
Neutral
228
-
96,506
14,252
18,465
55.9
48.3
15.8
21.5
14.5
10.6
2.4
2.1
17.0
20.7
6.8
5.2
Hindalco
Neutral
163
-
33,608
107,899
112,095
7.4
8.2
9.2
13.0
17.7
12.5
0.9
0.8
4.8
6.6
0.8
0.8
JSW Steel
Neutral
1,782
-
43,071
53,201
58,779
16.1
16.2
130.6
153.7
13.6
11.6
1.8
1.6
14.0
14.4
1.6
1.4
NMDC
Neutral
108
-
42,878
6,643
7,284
44.4
47.7
7.1
7.7
15.2
14.1
1.3
1.3
8.8
9.2
4.2
3.8
SAIL
Neutral
49
-
20,155
47,528
53,738
(0.7)
2.1
(1.9)
2.6
18.8
0.5
0.5
(1.6)
3.9
1.3
1.2
Vedanta
Neutral
175
-
51,941
71,744
81,944
19.2
21.7
13.4
20.1
13.1
8.7
1.1
1.0
8.4
11.3
1.1
0.8
Tata Steel
Neutral
378
-
36,693
121,374
121,856
7.2
8.4
18.6
34.3
20.3
11.0
1.3
1.2
6.1
10.1
0.9
0.9
Oil & Gas
Cairn India
Neutral
205
-
38,435
9,127
10,632
4.3
20.6
8.8
11.7
23.3
17.5
0.8
0.7
3.3
4.2
5.7
4.7
GAIL
Neutral
386
-
48,951
56,220
65,198
9.3
10.1
27.1
33.3
14.2
11.6
1.3
1.2
9.3
10.7
1.1
0.9
ONGC
Neutral
242
-
206,786
137,222
152,563
15.0
21.8
19.5
24.1
12.4
10.0
1.1
1.0
8.5
10.1
1.8
1.6
Indian Oil Corp
Neutral
574
-
139,255
373,359
428,656
5.9
5.5
54.0
59.3
10.6
9.7
1.6
1.5
16.0
15.6
0.5
0.5
Reliance Industries
Neutral
1,066
-
345,580
301,963
358,039
12.1
12.6
87.7
101.7
12.2
10.5
1.2
1.1
10.7
11.3
1.6
1.3
Pharmaceuticals
Alembic Pharma
Neutral
631
-
11,894
3,483
4,083
20.2
21.4
24.3
30.4
26.0
20.8
5.9
4.7
25.5
25.3
3.4
2.8
Aurobindo Pharma
Accumulate
798
877
46,717
15,720
18,078
23.7
23.7
41.4
47.3
19.3
16.9
5.0
3.9
29.6
26.1
3.2
2.8
Sanofi India*
Neutral
4,290
-
9,881
2,357
2,692
17.3
17.3
153.5
169.2
28.0
25.4
4.7
3.8
25.8
28.4
3.9
3.2
Cadila Healthcare
Neutral
386
-
39,506
11,126
13,148
22.0
22.0
17.1
20.0
22.6
19.3
5.8
4.6
28.8
26.6
3.6
2.9
Cipla
Sell
577
490
46,334
15,378
18,089
17.4
18.4
21.6
27.2
26.7
21.2
3.5
3.0
13.7
15.2
3.2
2.7
Stock Watch
August 31, 2016
Company Name
Reco
CMP
Target
Mkt Cap
Sales ( Čcr )
OPM(%)
EPS (Č)
PER(x)
P/BV(x)
RoE(%)
EV/Sales(x)
(Č)
Price ( Č)
( Č cr )
FY17E FY18E
FY17E
FY18E
FY17E
FY18E
FY17E
FY18E
FY17E
FY18E
FY17E
FY18E
FY17E
FY18E
Pharmaceuticals
Dr Reddy's
Neutral
3,091
-
52,715
16,043
18,119
23.1
24.7
126.0
157.8
24.5
19.6
3.6
3.1
15.7
17.1
3.2
2.8
Dishman Pharma
Sell
181
45
2,917
1,718
1,890
22.7
22.8
9.5
11.3
19.0
16.0
1.8
1.7
10.1
10.9
2.2
1.9
GSK Pharma*
Neutral
3,011
-
25,504
3,528
3,811
16.6
18.8
51.8
59.4
58.1
50.7
15.6
15.5
26.3
30.6
7.0
6.5
Indoco Remedies
Sell
319
225
2,940
1,112
1,289
18.2
18.2
13.2
15.6
24.2
20.5
4.3
3.6
19.2
19.2
2.8
2.4
Ipca labs
Accumulate
544
613
6,867
3,303
3,799
15.3
15.3
17.3
19.7
31.5
27.6
2.7
2.5
9.1
9.4
2.2
1.9
Lupin
Buy
1,510
1,809
68,054
15,912
18,644
26.4
26.7
58.1
69.3
26.0
21.8
5.1
4.1
21.4
20.9
4.4
3.6
Sun Pharma
Buy
775
944
186,410
31,129
35,258
30.0
30.9
28.0
32.8
27.7
23.6
4.2
3.5
18.7
18.9
5.6
4.7
Power
Tata Power
Neutral
77
-
20,853
36,916
39,557
17.4
27.1
5.1
6.3
15.1
12.2
1.3
1.2
9.0
10.3
1.6
1.4
NTPC
Neutral
162
-
133,412
86,605
95,545
17.5
20.8
11.8
13.4
13.7
12.1
1.4
1.3
10.5
11.1
2.9
2.9
Power Grid
Neutral
183
-
95,764
25,763
29,762
74.3
73.1
14.8
17.3
12.4
10.6
1.9
1.7
16.9
17.5
8.0
7.6
Real Estate
MLIFE
Buy
431
522
1,769
1,152
1,300
22.7
24.6
29.9
35.8
14.4
12.0
1.1
1.0
7.6
8.6
2.3
1.9
Telecom
Bharti Airtel
Neutral
332
-
132,754
105,086
114,808
34.5
34.7
12.2
16.4
27.2
20.3
1.8
1.7
6.8
8.4
2.2
1.9
Idea Cellular
Neutral
94
-
33,776
40,133
43,731
37.2
37.1
6.4
6.5
14.7
14.4
1.2
1.1
8.2
7.6
1.9
1.6
zOthers
Abbott India
Neutral
4,689
-
9,964
3,153
3,583
14.1
14.4
152.2
182.7
30.8
25.7
151.3
129.2
25.6
26.1
2.9
2.5
Bajaj Electricals
Neutral
264
-
2,670
5,099
5,805
5.7
5.9
11.4
14.6
23.2
18.1
3.1
2.8
13.4
15.1
0.5
0.5
Finolex Cables
Neutral
437
-
6,684
2,883
3,115
12.0
12.1
14.2
18.6
30.8
23.5
16.4
14.3
15.8
14.6
2.0
1.8
Goodyear India*
Accumulate
556
631
1,282
1,598
1,704
10.4
10.2
49.4
52.6
11.3
10.6
51.9
45.6
18.2
17.0
0.5
64.3
Hitachi
Neutral
1,518
-
4,126
2,081
2,433
8.8
8.9
33.4
39.9
45.4
38.0
36.7
30.6
22.1
21.4
2.0
1.7
Jyothy Laboratories
Neutral
310
-
5,614
1,440
2,052
11.5
13.0
8.5
10.0
36.5
31.0
8.8
8.2
18.6
19.3
4.2
2.9
Page Industries
Neutral
14,820
-
16,530
2,450
3,124
20.1
17.6
299.0
310.0
49.6
47.8
330.1
252.0
47.1
87.5
6.8
5.4
Relaxo Footwears
Neutral
460
-
5,519
2,085
2,469
9.2
8.2
7.6
8.0
60.8
57.9
23.6
20.1
17.9
18.8
2.7
2.3
Siyaram Silk Mills
Neutral
1,315
-
1,232
1,799
2,040
11.6
11.7
104.9
122.4
12.5
10.7
2.1
1.8
16.4
16.4
0.9
0.8
Styrolution ABS India*
Neutral
577
-
1,015
1,440
1,537
9.2
9.0
40.6
42.6
14.2
13.6
36.3
33.0
12.3
11.6
0.7
0.6
TVS Srichakra
Accumulate
2,601
2,932
1,992
2,304
2,614
13.7
13.8
231.1
266.6
11.3
9.8
292.3
230.1
33.9
29.3
0.9
0.7
HSIL
Neutral
351
-
2,534
2,384
2,515
15.8
16.3
15.3
19.4
22.9
18.1
22.8
19.6
7.8
9.3
1.2
1.1
Kirloskar Engines India
Neutral
277
-
4,000
2,554
2,800
9.9
10.0
10.5
12.1
26.3
22.9
11.0
10.4
10.7
11.7
1.2
1.1
Ltd
M M Forgings
Neutral
430
-
519
546
608
20.4
20.7
41.3
48.7
10.4
8.8
58.9
52.1
16.6
17.0
0.8
0.7
Banco Products (India)
Neutral
215
-
1,535
1,353
1,471
12.3
12.4
14.5
16.3
14.8
13.2
20.4
18.4
14.5
14.6
1.1
115.4
Competent Automobiles Neutral
175
-
108
1,137
1,256
3.1
2.7
28.0
23.6
6.3
7.4
33.7
30.4
14.3
11.5
0.1
0.1
Stock Watch
August 31, 2016
Company Name
Reco
CMP
Target
Mkt Cap
Sales ( Čcr )
OPM(%)
EPS (Č)
PER(x)
P/BV(x)
RoE(%)
EV/Sales(x)
(Č)
Price ( Č)
( Č cr )
FY17E
FY18E
FY17E
FY18E
FY17E
FY18E
FY17E
FY18E
FY17E
FY18E
FY17E
FY18E
FY17E
FY18E
zOthers
Nilkamal
Neutral
1,253
-
1,870
1,995
2,165
10.7
10.4
69.8
80.6
18.0
15.6
71.6
62.2
16.6
16.5
0.9
0.8
Visaka Industries
Neutral
188
-
298
1,051
1,138
10.3
10.4
21.0
23.1
8.9
8.1
24.0
22.5
9.0
9.2
0.5
0.5
Transport Corporation of
Neutral
180
-
1,380
2,671
2,911
8.5
8.8
13.9
15.7
13.0
11.5
1.8
1.6
13.7
13.8
0.6
0.6
India
Elecon Engineering
Accumulate
57
63
621
1,482
1,660
13.7
14.5
3.9
5.8
14.6
9.8
3.4
3.2
7.8
10.9
0.7
0.7
Surya Roshni
Accumulate
183
201
800
3,342
3,625
7.8
7.5
17.3
19.8
10.6
9.2
20.1
16.1
10.5
10.8
0.5
0.4
MT Educare
Neutral
139
-
554
366
417
17.7
18.2
9.4
10.8
14.9
12.9
3.3
2.9
22.2
22.3
1.4
1.2
Radico Khaitan
Buy
103
125
1,371
1,659
1,802
13.0
13.2
6.3
7.4
16.3
14.0
1.4
1.3
8.6
9.3
1.3
1.2
Garware Wall Ropes
Accumulate
479
524
1,047
873
938
12.9
13.1
30.9
34.9
15.5
13.7
2.4
2.1
15.7
15.2
1.1
1.0
Wonderla Holidays
Neutral
409
-
2,311
287
355
38.0
40.0
11.3
14.2
36.2
28.8
5.2
4.5
21.4
23.9
7.7
6.3
Linc Pen & Plastics
Neutral
278
-
410
382
420
9.3
9.5
13.5
15.7
20.6
17.7
3.5
3.1
17.1
17.3
1.1
1.0
The Byke Hospitality
Neutral
159
-
636
287
384
20.5
20.5
7.6
10.7
20.9
14.8
4.4
3.5
20.7
23.5
2.2
1.7
Interglobe Aviation
Neutral
881
-
31,746
21,122
26,005
14.5
27.6
110.7
132.1
8.0
6.7
47.6
34.0
168.5
201.1
1.5
1.2
Coffee Day Enterprises
Neutral
245
-
5,037
2,964
3,260
20.5
21.2
4.7
8.0
-
30.6
2.8
2.6
5.5
8.5
2.1
1.9
Ltd
Navneet Education
Neutral
104
-
2,481
1,062
1,147
24.0
24.0
6.1
6.6
17.1
15.7
3.5
3.1
20.6
19.8
2.4
2.2
Navkar Corporation
Buy
198
265
2,823
408
612
42.9
42.3
6.8
11.5
29.2
17.2
2.0
1.8
6.9
10.5
7.8
5.2
UFO Moviez
Neutral
480
-
1,324
619
685
33.2
33.4
30.0
34.9
16.0
13.7
2.2
1.9
13.8
13.9
1.8
1.5
VRL Logistics
Neutral
288
-
2,631
1,902
2,119
16.7
16.6
14.6
16.8
19.8
17.1
4.3
3.8
21.9
22.2
1.5
1.3
Team Lease Serv.
Neutral
1,135
-
1,940
3,229
4,001
1.5
1.8
22.8
32.8
49.8
34.6
5.3
4.6
10.7
13.4
0.5
0.4
S H Kelkar & Co.
Neutral
337
-
4,870
1,036
1,160
15.1
15.0
6.1
7.2
55.2
46.9
5.9
5.4
10.7
11.5
4.6
4.0
Quick Heal
Neutral
242
-
1,694
408
495
27.3
27.0
7.7
8.8
31.3
27.5
2.9
2.9
9.3
10.6
3.3
2.7
Narayana Hrudaya
Neutral
311
-
6,354
1,873
2,166
11.5
11.7
2.6
4.0
117.6
78.4
7.2
6.5
6.1
8.3
3.5
3.0
Manpasand Bever.
Neutral
751
-
3,759
836
1,087
19.6
19.4
16.9
23.8
44.4
31.5
5.3
4.7
12.0
14.8
4.2
3.2
Parag Milk Foods
Neutral
324
-
2,724
1,919
2,231
9.3
9.6
9.5
12.9
34.3
25.0
5.3
4.4
15.5
17.5
1.6
1.3
Source: Company, Angel Research; Note: *December year end; #September year end; &October year end; Price as on August 30, 2016
Market Outlook
August 31, 2016
Research Team Tel: 022 - 39357800
DISCLAIMER
Angel Broking Private Limited (hereinafter referred to as “Angel”) is a registered Member of National Stock Exchange of India
Limited,Bombay Stock Exchange Limited and Metropolitan Stock Exchange Limited. It is also registered as a Depository Participant with
CDSL and Portfolio Manager with SEBI. It also has registration with AMFI as a Mutual Fund Distributor. Angel Broking Private Limited is a
registered entity with SEBI for Research Analyst in terms of SEBI (Research Analyst) Regulations, 2014 vide registration number
INH000000164. Angel or its associates has not been debarred/ suspended by SEBI or any other regulatory authority for accessing
/dealing in securities Market. Angel or its associates/analyst has not received any compensation / managed or
co-managed public offering of securities of the company covered by Analyst during the past twelve months.
This document is solely for the personal information of the recipient, and must not be singularly used as the basis of any investment
decision. Nothing in this document should be construed as investment or financial advice. Each recipient of this document should make
such investigations as they deem necessary to arrive at an independent evaluation of an investment in the securities of the companies
referred to in this document (including the merits and risks involved), and should consult their own advisors to determine the merits and
risks of such an investment.
Reports based on technical and derivative analysis center on studying charts of a stock's price movement, outstanding positions and
trading volume, as opposed to focusing on a company's fundamentals and, as such, may not match with a report on a company's
fundamentals. Investors are advised to refer the Fundamental and Technical Research Reports available on our website to evaluate the
contrary view, if any.
The information in this document has been printed on the basis of publicly available information, internal data and other reliable
sources believed to be true, but we do not represent that it is accurate or complete and it should not be relied on as such, as this
document is for general guidance only. Angel Broking Pvt. Limited or any of its affiliates/ group companies shall not be in any way
responsible for any loss or damage that may arise to any person from any inadvertent error in the information contained in this report.
Angel Broking Pvt. Limited has not independently verified all the information contained within this document. Accordingly, we cannot
testify, nor make any representation or warranty, express or implied, to the accuracy, contents or data contained within this document.
While Angel Broking Pvt. Limited endeavors to update on a reasonable basis the information discussed in this material, there may be
regulatory, compliance, or other reasons that prevent us from doing so.
This document is being supplied to you solely for your information, and its contents, information or data may not be reproduced,
redistributed or passed on, directly or indirectly.
Neither Angel Broking Pvt. Limited, nor its directors, employees or affiliates shall be liable for any loss or damage that may arise from
or in connection with the use of this information.